Music Streaming Services: A Comparison of Data Usage & User Preference
Erika Rumbold | erumbold@uvic.ca | Course Project for CSC 561: Multimedia Systems
Table of Contents
- Project Report
- Video Overview
- Project Proposal - October 9th
- Interim Update 1 - October 23rd
- Interim Update 2 - November 6th
- Interim Update 3 - November 20th
Project Report
Video Overview
Project Proposal - October 9, 2023 (revised November 13)
In the current day in age, streaming services are the main means of consuming digital media - be it movies, TV, or music. As such, more and more services have emerged in competition with each other to gain our usership. For film and television, many streaming services feature exclusive content (e.g., Netflix original series) that make it worthwhile for users to subscribe to multiple. Music streaming services, however, host a lot of the same content, so users tend to choose one as their go-to streaming service. As consumers, we want to make informed decisions about how we spend our money, but it can be difficult to decide when there are so many streaming services to choose from.
There are numerous articles that highlight and compare the different music streaming services. In their efforts to appeal to a wide audience, however, these articles take a very generalized approach, recommending each of the services depending on whatever type of user you may be (e.g., CNET recommends Tidal for rock and urban fans but YouTube Music for Android users). For this project, I will make a comparison of music streaming services with a more analytical approach.
For this project, I plan to use Amazon Music, Apple Music, Spotify, Tidal, and YouTube Music. My analysis will have both an objective analysis component and a subjective component. The objective metric to investigate is the data usage while using each streaming service on the same device, connected to Wi-Fi or with an ethernet connection. The subjective component will be a user study. I will make a survey available to classmates and personal friends. The survey will ask the following questions:
- What type(s) of phone do you have? (iPhone, Samsung, Google, etc.)
- What type(s) of computer do you have? (Mac, Windows, Linux)
- Which of the following music streaming services have you used at least once?
- Amazon Music
- Apple Muisc
- Spotify
- Tidal
- YouTube Music
- Which of the above music streaming services is your favorite and why?
- On a 1-5 scale, how important is audio quality for your music listening experience?
- On a 1-5 scale, how much does a music streaming service's data usage affect your choice of preferred service?
My expected deliverables and timeline are as follows:
- October 23: User study completed, initial investigation of network monitoring methods
- November 6: Network monitoring experiment completed for 1+ service (Midterm Update due)
- November 20: All network monitoring experiments completed
- December 4: Data analysis completed (Demo due)
- December 11: Final report due
Update - October 23, 2023
I have sent out a survey form to different groups of people for the subjective component of my project, and I have already received several responses. Although I don't expect to get enough responses to have statistical significance, I still believe it'll be enough to make general observations about what users may be looking for in a music streaming service. The survey can be found here (https://forms.gle/uJZGUikM5KXQHcZj8) and will remain open to responses until I need to analyze the data - most likely the week before the Demo is due.
For the data logging component, I've decided to work in Python since it's my most proficient language. I found a tutorial (https://thepythoncode.com/article/make-a-network-usage-monitor-in-python) that demonstrates how to make a network traffic monitor per process using the psutil and scapy libraries. Between this update and next, I plan to adapt the tutorial code to log the traffic from each service's desktop app while streaming music. Note: YouTube Music currently does not have a native desktop app available, so I will be logging traffic from my web browser instead.
Although the streaming services don't all have desktop apps, they do all have iOS apps. I'm unsure how I'd be able to monitor the traffic from my phone at the moment, but I'll spend some time this week to find a possible solution. Ideally, I'd like to do these experiments on both a computer and a phone since people most often listen to music on their phones, moreso than on their computers. If I can't find a suitable method by next update, I'll focus on just the desktop experiments.
Update - November 6, 2023
Overall, I am on target with the biweekly goals that were set in the project proposal. Since the last update, I've successfully adapted the scapy tutorial to log the data usage of a music streaming app. I've also recorded data from one experiment run.
In each experiment, I'm recording the data usage while playing an 18-song album that is 75 minutes long (X Infinity by Watsky). The data usage while streaming music can vary greatly depending on how many songs are played and the length of each song. Playing the same album on each streaming service serves as an experimental constant and eliminates such variability.
Very few modifications need to be made to my code between experiments, so I should have enough time to run experiments for each service, both at the base level of audio quality as well as any higher quality options the streaming services offer.
I've gotten several more responses to the survey, which is still open to responses.
Proposal Changes
The project proposal reflects these adjustments.
- Add YouTube Music as one of the observed streaming services
- Write the survey questions exactly as they appear in the survey
- Survey participants include classmates and personal friends
Update - November 20, 2023
Experiment
I have completed all of the network logging trials, as planned in the project proposal. Covering the different quality levels offered by each of the five streaming services, 13 trials were completed to record the data used when streaming X Infinity.
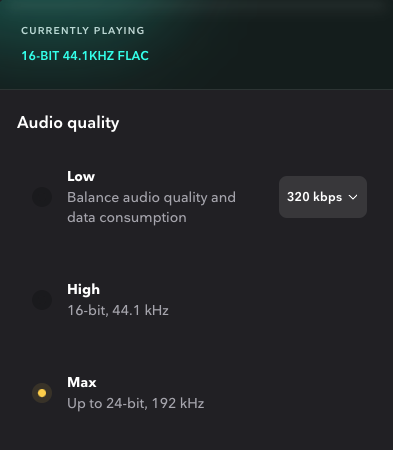
During these trials, I realized that some streaming services define their quality level options by data rate (e.g., 128 kbit/s), while others are defined by the recording quality (i.e., bit depth and sample rate). For the latter, songs that were recorded at a lower quality won't necessarily be improved, or use more data, when streamed with a higher quality setting active. For example, Tidal's Max setting is capable of supporting audio up to 24-bit, 192kHz; X Infinity is only available at 16-bit, 44.1kHz - the same settings as Tidal's High quality option. This means, Tidal will only play X Infinity at High quality.
Tidal and Amazon Music label music that is capable of being played at their highest quality setting, Max and Ultra HD, respectively. To fully see the capabilities of these premium settings, I ran additional trials using albums that have those labels.
Initial Observations
This week will be dedicated to analysis and visualization of the collected data, both from the data usage experiment and the user study. As such, I haven't gone fully in depth with the data quite yet, but I can comment on some initial observations.
For the experiments, Spotify transmitted the least data of all five streaming services, and Tidal the most. Also, Spotify is the most used and most preferred service by those who responded to the user study (21 participants). However, I presume this is mostly due to Spotify being the oldest of these music streaming services; several participants noted that they've only tried Spotify, having no interest in trying any other services as they emerged.
Setbacks
Unfortunately, I wasn't able to find a way to log data usage from a mobile device. And if I had, I'm not sure I would've had enough time to execute those trials for this project. Perhaps this could be future work by myself or someone else who's interested.
Next Steps
As mentioned above, I plan to spend this week doing data analysis and visualization. Then, the next week will be dedicated to recording my demo video and creating an outline for the final project report.